h
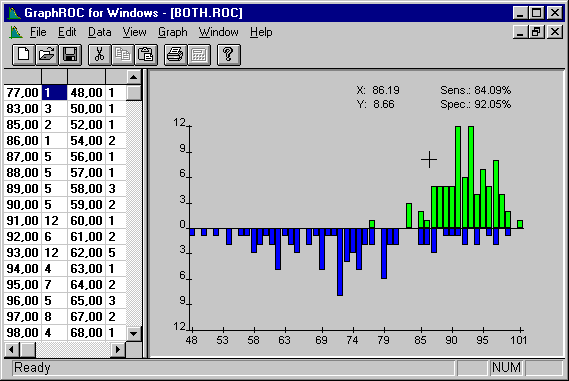
Figure 3. Example of two distribution display. Eryhtrocyte MCV-values (fl) in healthy controls (upper distribution) and in patients with iron deficiency anaemia (lower distribution). X-, Y-, Se-, and Sp-values update with cursor movement.

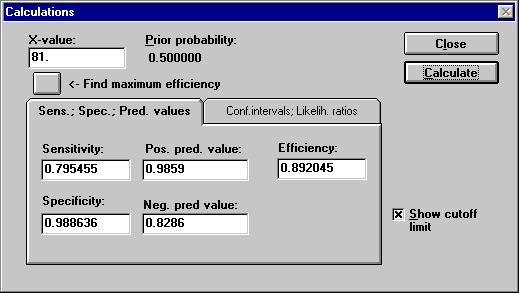
Figure 4. The Calculations -dialog box can be opened anywhere on the two distribution display by clicking the left mouse button. The box includes numeric values specific for the cutoff limit. The values can be recalculated for any entered X-value. The default for prior probability of disease is the proportion of illness related values in source data, but this value can be changed for recalculation of predictive values and efficiency.