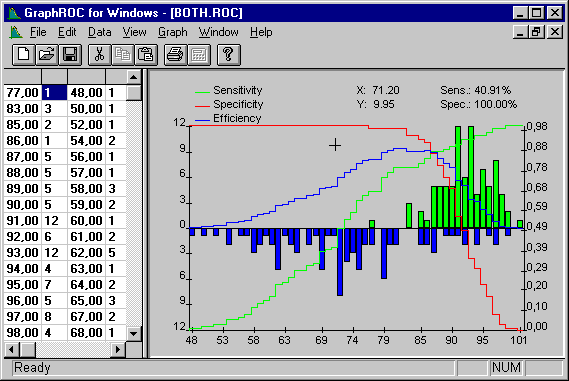

Figure 5. Same distributions as in Fig. 3. The clinical sensitivity, clinical specificity, and efficiency curves, with their scale on the right side of the graph, have all been chosen for simultaneous display from the Graph Options. The X-, Y-, clinical ensitivity and specificity values in the upper right corner update instantaneously for any pointer location.