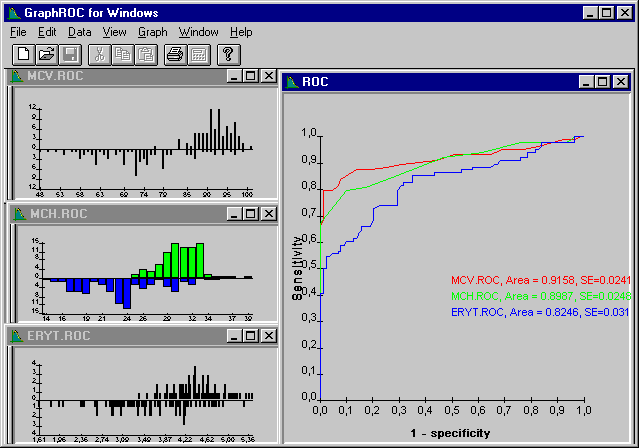

Figure 8. The Receiver operating characteristics (ROC) curves can be generated simply by selecting Graph ROC curve when the two distributions display window is active. The non-parametric ROC curve is generated using all possible cutoff limits. In this example several ROC curves have been combined into one graph. The ROC-curve for MCV (erythrocyte mean corpuscular volume) corresponds to the uppermost figure in the left, the same frequency distributions are also shown in Fig. 5. In addition to that the ROC curves for MCH (erythrocyte mean corpuscular hemoglobin) and Eryt (erythrocyte count) are shown as obtained from the same set of samples. The areas under curve (Area) with corresponding standard errors (SE) are shown under the curves.