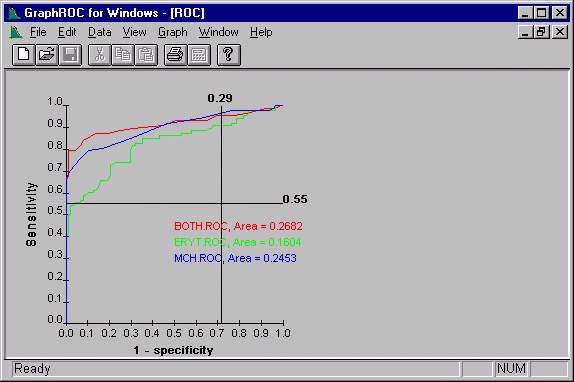
Figure 11. In this figure the same ROC curves are shown as in Fig. 8. The estimation of the area under the curve has been restricted only to the region where the clinical sensitivity is at least 55% and specificity at least 29%. The sensitivity and specificity lines can be moved and the partial areas under curves recalculated for any combination of sensitivity and specificity limits.