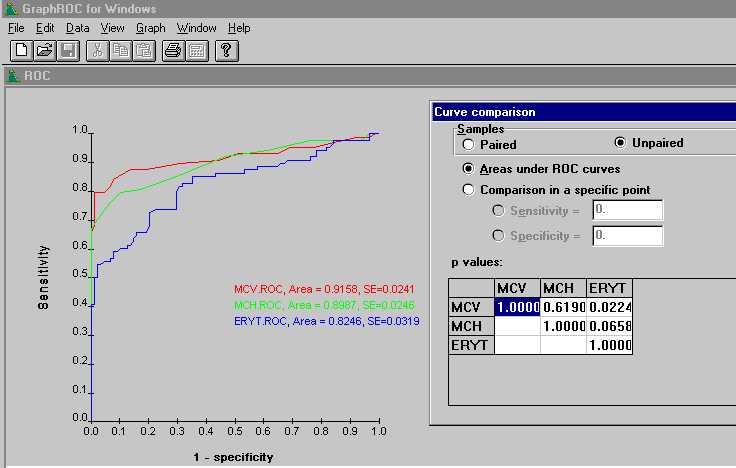

Figure 9. In this example the command Data Compare ROC curves was given when the ROC curves window included three ROC curves. The names of the ROC curves will become visible as row and column titles in the p values table. This example shows the unpaired comparison of areas under the curves. GraphROC includes both the unpaired and paired methods of comparison of areas under curves and of individual points on two ROC curves. For paired comparison, see Figure 10 below.
The p-values calculated by GraphROC are two-tailed significancies of difference between the two ROC curves. If there is no a priori knowledge that either of the two tests is better than the other, then this two-tailed test is appropriate. However, if there is a prior knowledge that e.g. test 2 is likely to better than test 1 and if we are only interested in improvements, then the one-tailed test is appropriate. To obtain the one-tailed significance of difference, divide the p-value given by GraphROC by two.

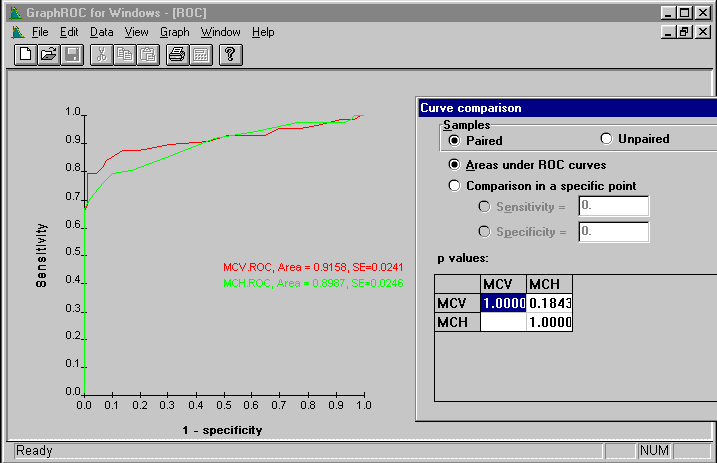
Figure 10. The MCV and MCH values originated from the same set of samples and thus paired method could be used here for the comparison of areas under the ROC curves. The p-value for paired comparison is 0.184 when for unpaired comparison it was 0.619 (see above). By the paired comparison smaller differences may be judged as significant because the method considers the natural within-subject correlation of test results.