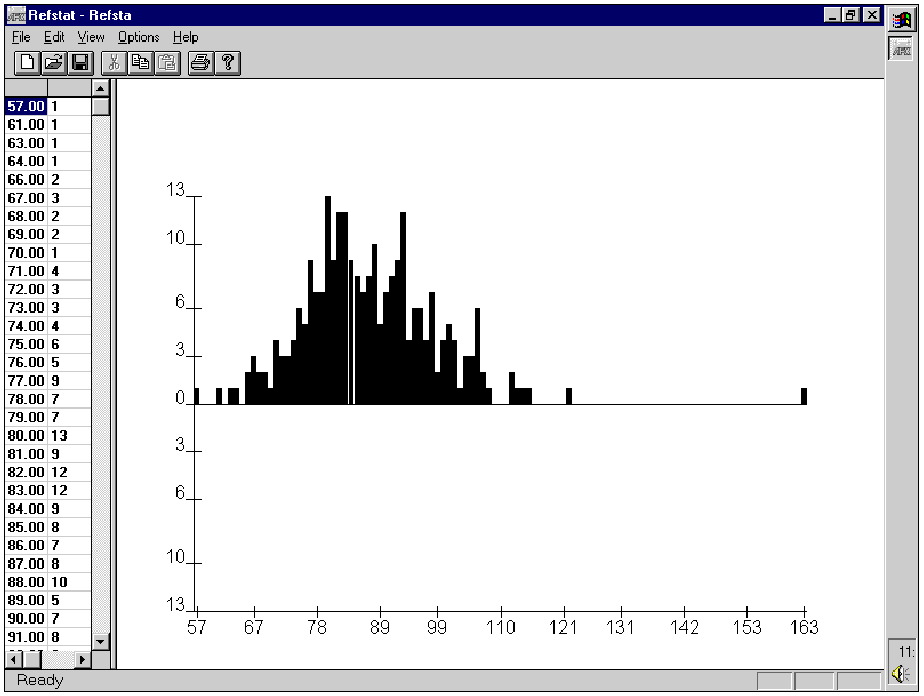

Figure 1. Display of the reference distribution. In this
example the original set of reference values represented 240 healthy adult individuals,
whose serum creatinine levels (umol/l) were measured. Distributional data of these values
are shown above.