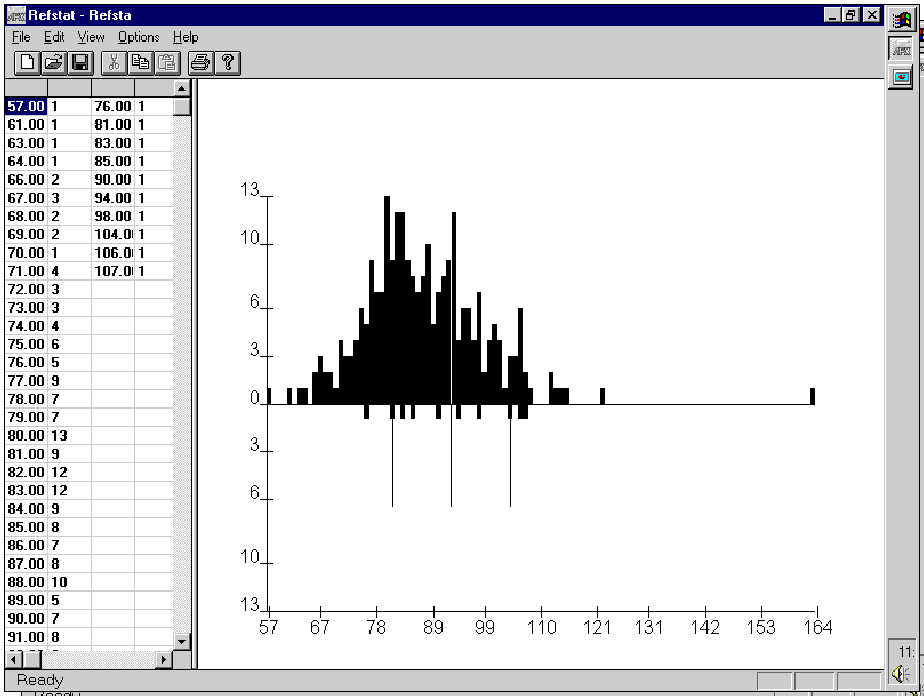

Figure 2. Both the original distribution and the distribution of test data
are now shown in the same figure. The original set of reference
values for serum creatinine (umol/l) represented 240 healthy adult individuals. The test
data consisted of 10 creatinine values from healthy individuals. In the graph the 10
test data values are shown below the x-axiw; the horizontal lines represent 20th, 50th,
and 80th percentiles of the test data.
Distributional data of these values are shown in the data window.