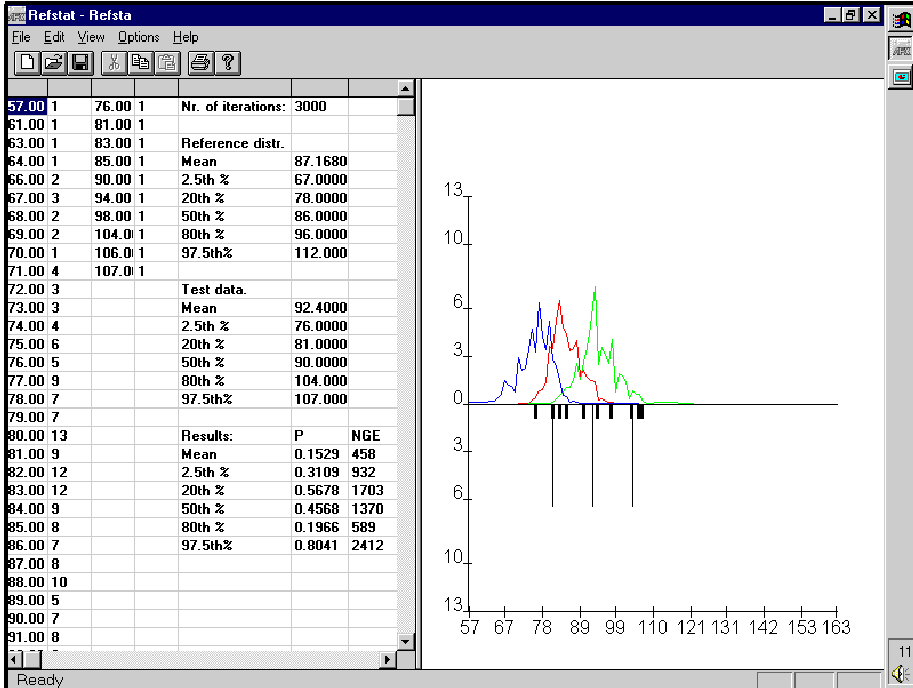

Figure 4. Otherwise the graph is the same as in Figure 3, but for clarity the original reference distribution has
been removed. The calculation results are visible in the data window. The NGE is the
number of simulated cases in which the defined percentile was more far away from
corresponding percentile in reference distribution than the same value of the test data.
P-values are the probabilities of the null hypothesis that the test data mean or
percentiles represent a random sample from the reference distribution.