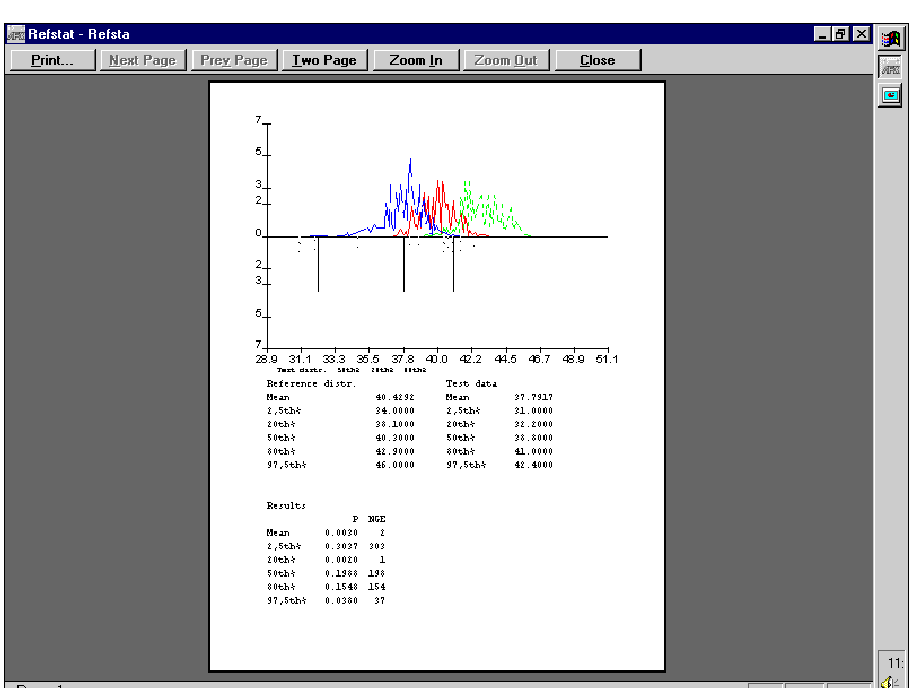

Figure 7. An example of a printout generated by Refstat. The data window shows the calculated values for the 2.5th, 20th, 50th, 80th, and 97.5th percentiles as well as for the mean. P-values are calculated for each of these percentiles.
For clarity the graph shows here only the 20th, 50th, and 80th percentiles of the test data and of the 1000 simulated samples are shown, original frequency distributions have not been chosen for display.