Features include
- Microsoft Windows commands and user interface
- rapid import of source data as a simple text(ASCII)file containing all original
observations
- display of the distribution with a possibility to rapidly calculate any
percentile and the corresponding confidence limits
- estimation of non-parametric reference limits, median or any percentile in the
distribution with the corresponding confidence limits
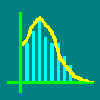
- possibility to choose statistically optimized bin width for illustrative
presentation of frequency histograms
- display of two distributions for comparison of health- and illness-related data
- automatic updating of clinical sensitivity and specificity values with mouse
movement
- display of clinical sensitivity and specificity with the corresponding confidence
intervals, positive and negative likelihood ratios, predictive values and efficiency at
any level of test result
- rapid updating of predictive values and efficiency to any entered prior
probability of disease
- optional presentation of sensitivity, specificity and/or efficiency curves for
the complete range of possible cutoff limits
- Receiver operating characteristics (ROC-) curve features include
- display of one or several curves
- calculation of areas under curve by non-parametric method including estimation of
respective standard errors for the area
- statistical comparison of areas under two ROC curves either by the paired or
unpaired method
- statistical comparison of points on two ROC curves either by the paired or
unpaired method
- optional possibility to estimate partial areas under ROC curves
- quick and simple data import and export between GraphROC and other software
- easy export of graphs for editing and e.g. for making slides or figures for
publication
- The following features of the program have, to our knowledge, not been included
in previously available laboratory test evaluation software:
- possibility to automatically optimize the bin width for display of frequency
histograms and producing non-parametric ROC curves (Kairisto, 1995)
- possibility to estimate also partial areas under the ROC curve (see Zweig &
Campbell, 1993)
- estimation of non-parametric reference change limits and corresponding confidence
limits
- optional indirect estimation of "health" related limits from patient
data, where majority of the values can be considered to be representative of
health-related values
- optional indirect estimation of "health" related change intervals from
unselected or partially selected serial patient data, where majority of the values can be
considered to be representative of health-related values (Kairisto, Virtanen, Uusipaikka
et al. 1993)
- Full advantage of all features in GraphROC for Windows will be achieved if the
program is used together with other programs running under Microsoft Windows. Data import
and export, graph export, and switching from one program to another allow convenient use
of GraphROC together with other Windows applications.
|
GraphROC
FEATURES
EXAMPLES
DOWNLOAD
INSTRUCTIONS
REGISTER
|